Abstract:
This paper introduces the application of the Leica 3D laser scanner RTC 360 in the deformation of the steel structure at the top of a factory building. It explains the key procedures of field measurement and introduces the process of point cloud processing. The node balls in the steel structure were fitted using point cloud filtering, segmentation, and fitting techniques. Based on the fitting results, the distortion deformation of the steel structure was analyzed.
Site Condition:
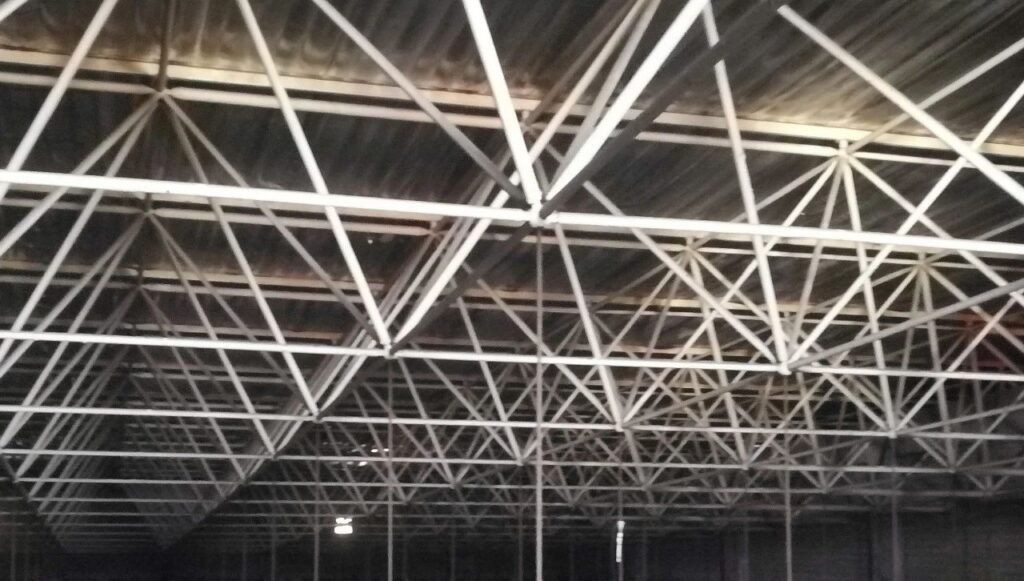
The top of a factory building is supported by a steel structure, where different spatial steel structures intersect at node balls. Below each node ball is a vertical steel structure connected to the roof slab of the factory building, with four horizontal steel structures extending in the cardinal directions connected to adjacent node balls, and four steel structures at a 45-degree angle connected to the top structure.
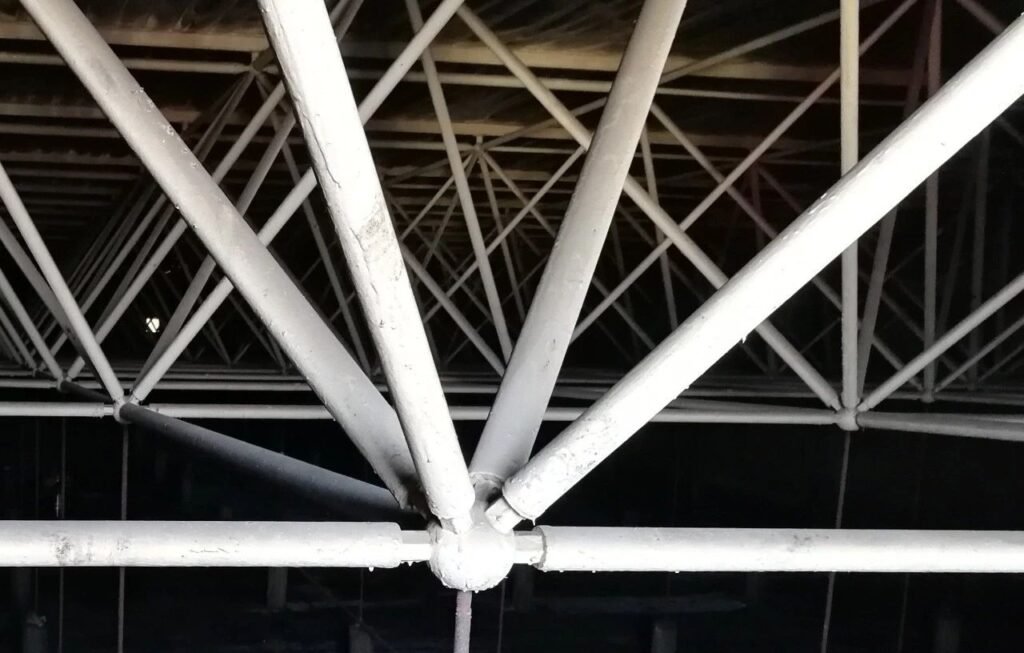
Due to a lack of maintenance over time, as well as the effects of various uneven loads and temperatures, the steel structure has deformed, affecting the safe operation of the factory building. It is necessary to detect the distortion deformation of each row and column of the horizontal steel structure to provide a basis for subsequent repair and reinforcement.
Field Measurement:
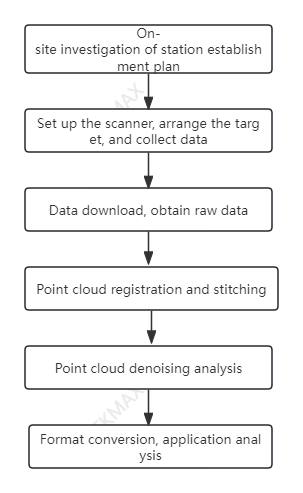
The Leica RTC 360 3D laser scanner was used to measure the on-site steel structure and obtain three-dimensional point clouds. The RTC360’s built-in visual tracking technology significantly improves the efficiency of stitching. Considering the complexity of the actual site and the lack of spatial features, several black and white targets were placed on-site for the stitching and verification of adjacent stations.

After the field data collection was completed, the raw data were downloaded, and the point clouds of each station were stitched together and then filtered to remove noise. The processed steel structure is shown in the following figure.
Point Cloud Processing:
After the field data collection is completed, download the raw data and stitch the point clouds of each survey station. Then, perform point cloud filtering and noise reduction processing. The processed steel structure is shown in the following figure.

Cut and extract the point cloud of each row and column of the steel structure, further optimize the point cloud, appropriately simplify it. The point cloud diagram of a certain column of the steel structure is as follows:

Segment and extract the three-dimensional point cloud of each node sphere, and fit spatial spheres based on the point cloud.


According to the design data of installation, without deformation, each node ball on every row and column is located on a straight line in space. Analyzing and calculating the distance between the center of each node ball and the axis line of installation design represents the distortion deformation situation.
Connect the centers of two node balls at both ends of each row and column with a straight line, as shown in the diagram below.

From the figure below, it can be seen that when zooming in on the node spheres, the centers of some of the node spheres deviate from this straight line.
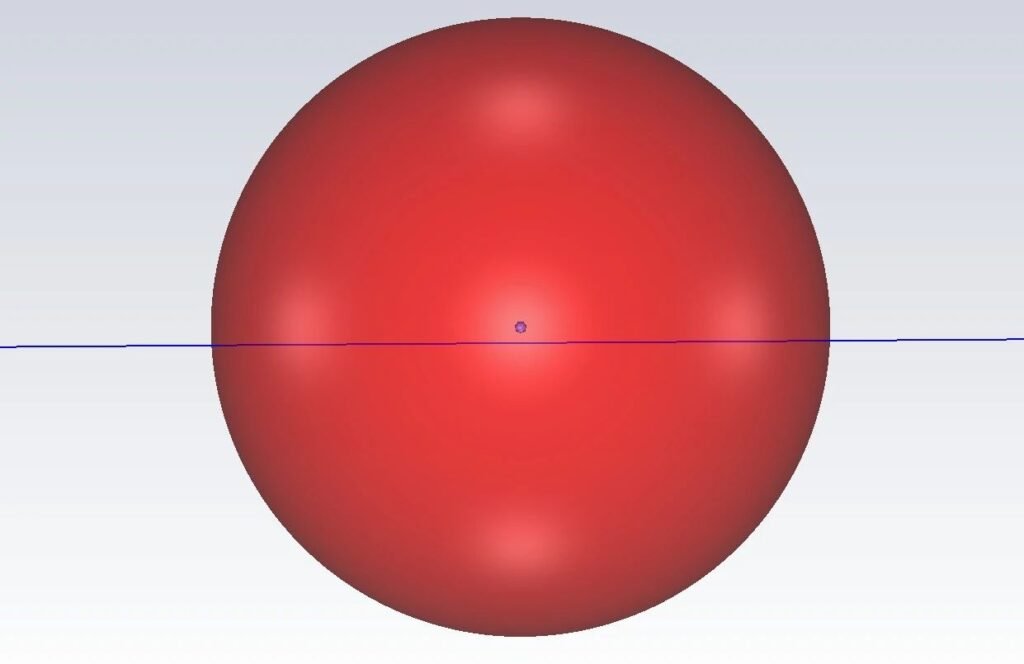
Build a spatial plane that passes through the center of the node sphere and intersects with a spatial line. As shown in the diagram below, measure the perpendicular distance between the center of the node sphere and the line to obtain the perturbation value. Alternatively, a spatial independent coordinate system can be constructed to calculate deformation values caused by perturbations.

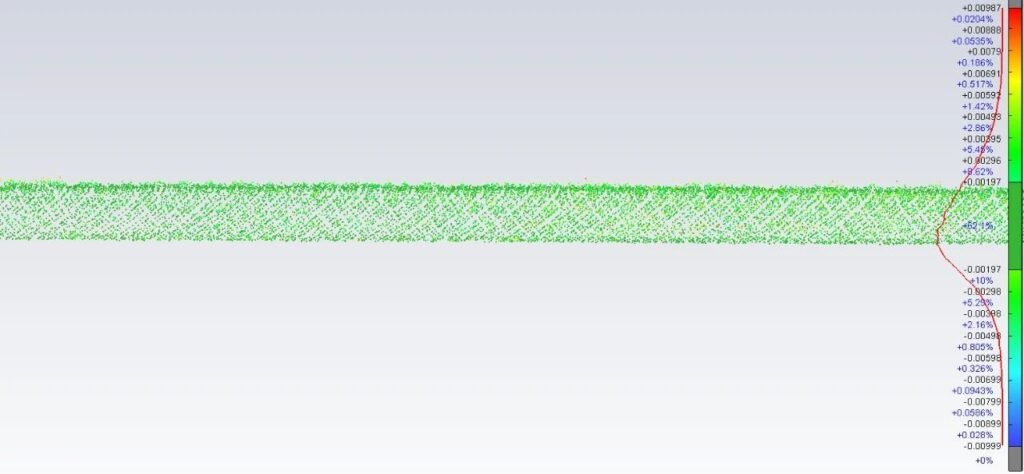
Due to the presence of disturbance deformation, there is also deformation between the cylindrical steel structures of the node spheres. By segmenting point clouds and fitting steel columns, spatial collision analysis can be performed between the measured 3D point cloud and the fitted steel columns to obtain the spatial deformation situation of the steel columns.
Conclusion:
The 3D laser scanner provides a more effective means of detecting similar deformations in steel structures. Compared to traditional total stations for data collection, it offers more accurate and comprehensive spatial information, as well as more reliable analysis and calculation results.
